|
|
 |
| Removing small value labels from PowerPoint charts |
 |
Value labels on charts help in understanding the presented data.
However, if there are too many labels, the less important ones tend to clutter the image.
Removing them may help in making the results easier to analyze.
Consider the following image:
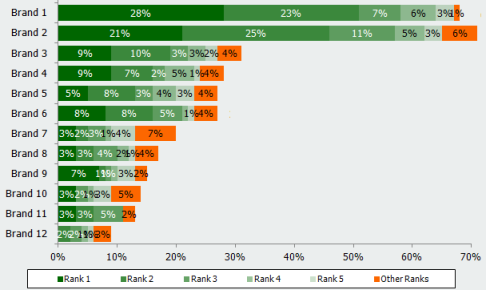
Those values lower than 4-5% don't really add anything to the slide;
and they make the chart harder to decipher.
Now, remove labels of values lower than, say, 5%; you get this:

Not only easier to understand, but looks better too.
Moreover, the higher results stand out much more clearly now.
Now, the macro to do that isn't very complicated.
The usual approach would be to record a simple macro (that deletes one value, for instance),
and work out how to loop through the different labels on a slide (and perhaps all slides in a presentation).
But since Microsoft decided to drop macro recording in PowerPoint (WTF?),
it's not that easy to come up with the code. So, here's the code, and the explanations follow.
  Sub RemoveSmallValuesFromChart(chart)

    Const valueThreshold As Double = 0.05

    For Each series In chart.SeriesCollection
      If series.HasDataLabels Then
        Dim pointCount As Integer
        Dim pointValues As Variant

        pointCount = series.Points.Count
        pointValues = series.Values

        For pointIndex = 1 To pointCount
          If pointValues(pointIndex) < valueThreshold Then
            series.Points(pointIndex).HasDataLabel = False
          End If
        Next pointIndex
      End If
    Next series

  End Sub
This first method handles the actual hiding of data labels, given a chart.
valueThreshold is the limit below which data labels will be hidden.
The first loop loops through all series of a chart; the second loop - through all points of a single series.
If it finds a point that has a value below the threshold - it hides its data label (by setting HasDataLabel to False).
  Sub RemoveSmallValuesFromAllCharts()

    For Each slide In ActivePresentation.Slides
      For Each shape In slide.Shapes
        If shape.HasChart Then
          Set chart = shape.Chart
          RemoveSmallValuesFromChart chart
        End If
      Next shape
    Next slide

  End Sub
This method loops through all slides and all shapes on these slides; if it finds a shape that contains a chart,
it calls the first method to clean up the chart.
  Sub RemoveSmallValuesFromSelectedChart()

    Set selection = Windows(1).Selection
    chartFound = False

    If Selection.Type = ppSelectionShapes Then
      If Selection.ShapeRange.Type = msoChart Or _
         Selection.ShapeRange.Type = msoPlaceholder Then
        If Selection.ShapeRange.Item(1).HasChart Then
          Set chart = Selection.ShapeRange.Item(1).Chart
          chartFound = True
          RemoveSmallValuesFromChart chart
        End If
      End If
    End If

    If Not chartFound Then
      MsgBox "Please select a chart first."
    End If

  End Sub
Finally, a method to clean up the chart selected by the user (a chart will be selected when any part of the chart is clicked).
If a shape containing a chart is currently selected, the first method is called to clean up that chart.
HTH
Top
|
| Comments |
#1
Vascool
wrote on
2012-04-19 12:33:47
|
I have copied all 3 codes in PPT 2010 and i found Compile Error: ByRef argument type mismatch in below code
RemoveSmallPercentsFromChart chart
Please help
|
#2
trybik
wrote on
2012-04-19 17:29:48
|
|
Hmm... I don't have PPT 2010 with me right now, but just try removing the 'As Chart' part from the declaration of the first sub.
|
#3
zzGreg
wrote on
2013-03-04 15:02:18
|
THANK-YOU!!!
If there were a way to rank everyone's VBA skills between 0 and 10, I think I would be around 0.3. I have only every used VBA in Excel, and in less than 2 minutes, I was able to remove a whole bunch of absolutely useless "0%" data labels from a presentation, with minimal modification to the code that you posted (yeah, I changed 1 character).
Thanks for sharing the code and also thank you for commenting it, so that even beginners like me can easily understand it!!!
|
#4
Joy
wrote on
2013-04-01 02:50:40
|
|
hi, I'm interested in doing this exact same thing except on Excel (so that I can paste my chart as an image on PPT). I have tried modifying this code for excel but have been unable to do it. Do you have a similar version of it for excel?
|
#5
trybik
wrote on
2013-07-02 08:50:04
|
|
The Excel version can be found here.
|
#6
Yatin
wrote on
2013-07-02 16:05:35
|
Hi! Thank you so much for the code. It is very helpful. Just wanted to check about another thing related to this -
Let's say there is a data point on the bar chart whose data value is 4%. Now using this code, I have been able to hide the data value of 4%, but now I would also want to hide the data point itself on the chart. This is primarily because I don't want my audience to even look at the data point whose value has been intentionally hidden.
Would request you to please do let me know about the solution to this problem.
Thanks once again!
|
#7
Yatin
wrote on
2013-07-02 16:13:55
|
Hi! Just adding to my point -
I want to remove only those data points whose all the values in the chart are 4% or less.
More clarification: Just like the way in the bar chart shown on this page, Brand 8 has all the values in the bar that are less than 5%, I would want to eliminate/hide only such cases. Not the ones like Brand 9, where one of the values is still more than 5%.
So, I would want to hide the data point of Brand 8 from the graph (both data point as well as the data values on the bar).
Thanks!
|
#8
Tejas
wrote on
2014-02-18 14:41:39
|
|
This is awesome macro. Can you please help to remove value labels less than 5% only from Stacked Column charts.
|
#9
Rohan Khole
wrote on
2021-06-05 18:58:54
|
Thanks for the code, but I have one issue, now I want this macro to run in the active presentation (i.e. I want this macro to be run in a different file or template) but not in the macro file, How can we do that? - Please help me on this
|
#10
mckushak
wrote on
2021-09-04 12:48:41
|
|
Hi, help me please. How to make the macro select 5% of the value but not in the charts with relative values. Namely in diagrams with absolutes. The macro independently calculates the amount for each column and calculates the share of the amount, and eliminates those that are less than 5% of the amount
|
|
Top |
|
Top
|
|
|