|
|
 |
| SPSS-2-Excel |
 |
Program for creating tabular reports in Excel based on SPSS data.
S2X (the application's nickname) imports data from SPSS.
Next, it allows the user to define tables (manually or automatically), that are next exported to tab-delimited files.
Finally, all tables are imported into Excel for further processing (also with a set of specialized macros).
Details:
Tables of five types can be defined in the program:
Allows you to display data from questions that usually form a table in the questionnaire,
such as a series of scales (multi-value variables) or maybe a question where the respondent indicates all statements
that fit the given brands (dichotomous variables).
Allows you to display means, for instance from a battery of scales
or maybe from a question where the respondent evaluates (on a scale) how well the different statements fit the various brands.
A classic table that displays data from a question split into various groups of respondents.
In this case, two dimensions of the table need to be defined: columns with dependent data and rows with independent data (or the other way around).
In both dimensions multi-value as well as dichotomous variables can be used.
Allows you to display means split into various groups of respondents.
Multi-value variables are placed in columns (that means will be calculated from)
and, just like in the previous table, independent variables should be placed in rows.
This table combines the two previously mentioned tables: cross-tabs and banners.
That is, in a single table you can view the distribution of a question's responses, as well as the mean,
all split into various groups of respondents. This table is usually used to display detailed data
of a multi-value variable, where in the columns you can see:
- its distribution,
- its mean and standard deviation,
- and additional data, such as top-two-boxes, for instance.
Top
The program assumes that the order of variables in the survey's data file reflects, in a natural way,
the setup of questions and responses in the questionnaire.
So, the definition of a table usually comes down to selecting only several parameters,
such as: the first variable, number of variables, spacing between consecutive variables.
Thus, tables are defined using one or two dialog windows that let you define variables in the table's dimensions.
These windows need some getting used to, but after a short while their usage is almost automatic.
As an example, let's take a look at the window that's used to define columns in cross-tabs:
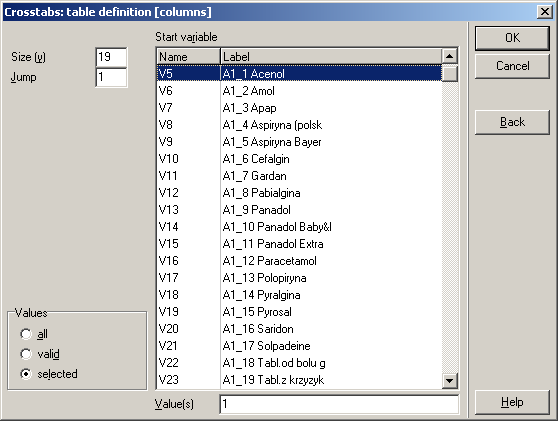
The main element in the window is the list of all numeric variables in the survey's data file ("Start variable").
This list is used to select the first variable that will be placed in the table's columns (here: V5).
Because in this case, these are dichotomous variables (describing, for instance, spontaneous awareness),
in the table's columns we would like to place all variables coming from this question - that's why
19 is entered in the "Size (y)" field. These variables are placed next to each other in the data file,
so 1 is entered in the field "Jump". Finally, we want to display data only for the positive responses ("yes")
for each variable - hence the appropriate definitions in the fields "Values" (selected) and "Value(s)" (1).
If in the table's columns we wanted to place all values of a multi-value variable,
the respective definition window could look as follows:
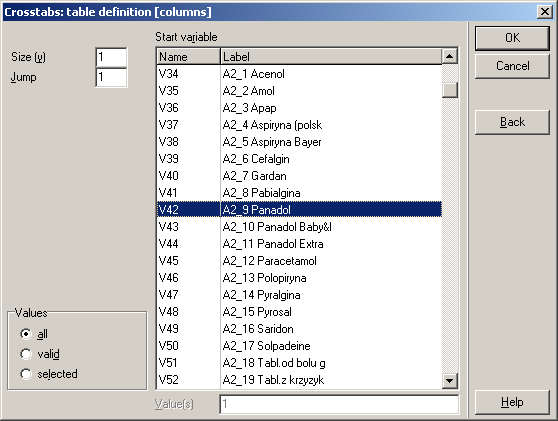
Here we assume that A2 is a question of the type: "How often do you use this product?" with responses such as these:
- 1 - once a week or more often,
- 2 - at least once a month, but less often than once a week,
- 3 - less often than once a month,
- 9 - hard to say.
In that case, in the table there will be 4 columns defined with the above values of responses.
If response 9 was defined as missing data, then we can define a table without this response
by using the option "valid" in the "Values" field.
Top
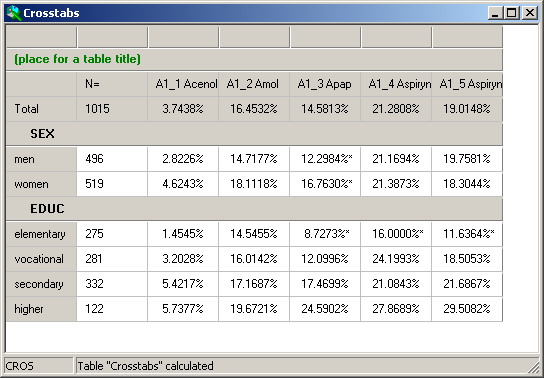
After the various dimensions are defined, the user is presented with a table, but the table is not calculated yet.
In the example below we have 5 dichotomous variables in columns:
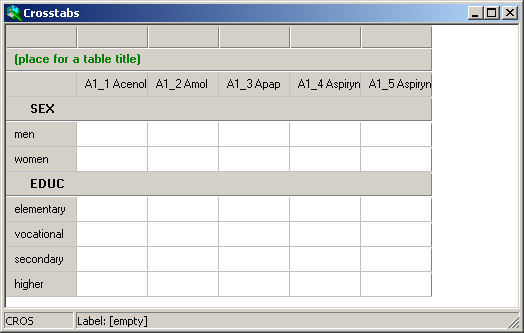
This is when the user can verify the correctness of the table's definition.
If it is not entirely correct, the user can:
- redefine it using the before mentioned dialog windows,
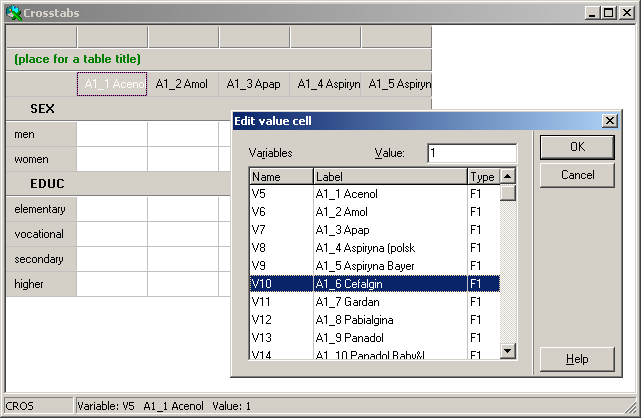
- change the definition of any of the cells in the table.
The second option may require a bit of an explanation.
All cells in a two-dimensional table are defined as a pair: (row variable + list of values), (column variable + list of values).
So, you can change the definition of the row and/or column by selecting another variable and/or list of values:
Incidentally, the construction of the table (when defining it) as well as the calculation procedure and data access methods
are very similar to the ones used by our latest application
YAC Data Analyzer -
it turns out that this kind of setup greatly facilitates tables' "internal" handling in the program...
Top
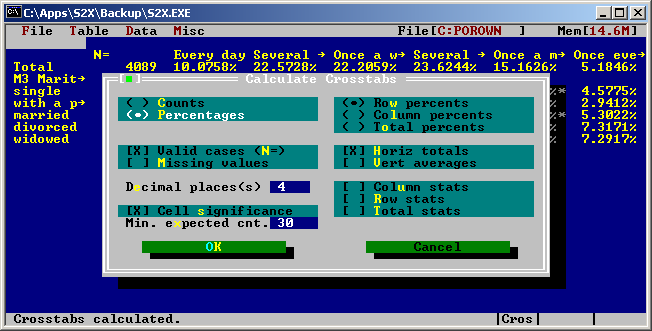
When the user determines that the table's definition is correct, calculations can be invoked;
the program will display a dialog window with the possible computation options:
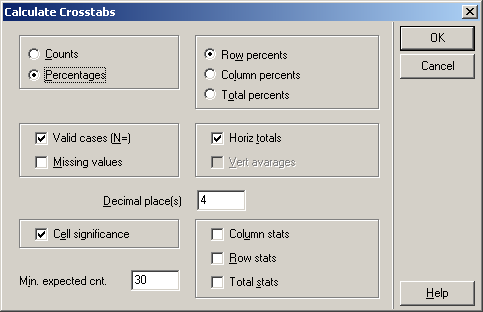
We have the following options here:
- calculate counts or percentages,
- in the case of percentages, calculate row, column or percentages to the total,
- display the calculation base,
- include missing data in the calculation base,
- display the total,
- set the number of significant digits for the results,
- mark those cells that significantly differ from the expected results (based on frequency distributions),
- define the minimum calculation base that the above statistic is still calculated for,
- calculate the significance of differences for each pair of cells in columns, rows, and/or the total.
Cells that significantly differ from the expected values are marked with an asterisk (*).
Significant differences between pairs are written to additional files in the form of tables.
Top
When a table is calculated, you can:
- save it to a file in the tab-delimited format,
- merge this file with another file (adding the new table below or to the right of another table)
- this allows the building of more complex tables that aren't easily defined with a single set of definition dialog windows,
- copy the results to the clipboard and later paste them into another program/document.
Top
There are several other functions available in the application
that should assist users in working with the data. These are:
In this window you can view basic information on all variables
(name, label, type, formatting, value label, missing values),
redefine missing values and view basic statistics:
- distribution: counts, percentages, valid percentages,
- mean,
- number of valid and missing values,
- number of valid and missing cases.
In this window, via a single click, you can move to the previous or the next variable,
and the above data will be displayed instantaneously (thanks to the proprietary format of the data file).
What's more, for sets of variables, the above data is displayed for the whole set.
The above mentioned sets of variables facilitate defining standard rows and/or columns.
For instance, if many cross-tabs have the same set of background variables,
this set can be defined here and then reused in all those definitions.
Data and calculations can be weighted by any of the numeric variables.
Calculations can be limited to a sub-group of respondents,
where this group is defined by a numerical expression; so, for instance, calculations can be executed for men only.
The filter would then be defined by the following expression: SEX = 1.
You can use arithmetic operators in filters, as well as comparison operators and logic operators (conjunction, alternative and negation),
e.g.: SEX = 1 | ( INCOME > 5 & CITY > 1 ).
The application can import data in the following formats:
- SPSS data files (.sav),
- fixed-ASCII,
- tab-delimited,
- comma separated values (CSV).
In the last three cases, another file is also needed: column descriptions (labels, values, missing data).
Variable descriptions can be in one of the following formats:
- SPSS File Info,
- SPSS Syntax (instructions DATA LIST, VARIABLE LABELS, VALUE LABELS and MISSING VALUES),
- DataGate scripts.
Top
Tables exported to tab-delimited files can then be easily imported into other applications, such as Excel.
Well, "easily" is a small exaggeration. First of all, there can be a lot of these files (one file per table)
and to import them manually into Excel is not that funny. And second: files are not formatted in any way
(fonts, colors, background), so you would need to spend some time on making them good looking.
Finally, you usually create standard charts based on these tables, which with tens or hundreds of tables,
becomes a fairly daunting task...
So, Wojciech A. Trybulec (my brother) finally got tired of this and wrote a series of Excel macros
that make all of the above operations easier. Later on I also worked on these macros,
mainly on updates that would handle new S2X functionality.
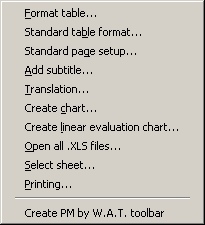
The consecutive options in the menu have the following functionality:
Opens all files in the given folder and moves them to a single workbook (in alphabetical order).
General formatting options:
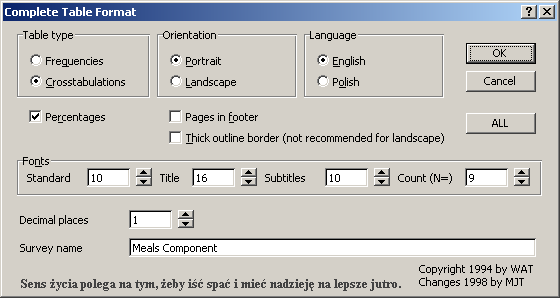
The "ALL" button goes through all tables in a workbook and applies the given formatting settings automatically.
A simplified version of the first dialog window that uses standard, predefined options for most settings.
This dialog window defines standard page settings for all tables and charts.
A dialog window that defines a common sub-title for all tables.
Changes auto-created texts between English and Polish.
This dialog window allows you to define standard charts based on the results in a table.
This dialog window defines linear charts for price data.
This dialog window allows you to go to the given table or chart;
it's a bit easier to use than the standard Excel sheet tabs.
A macro that prints all tables and/or charts, while keeping page settings specific to each table and chart.
Top
First versions of the program allowed for manual table definitions only.
What's more, a table's definition, after it was exported, wasn't saved anywhere.
Thus, if you needed to repeat calculations for a series of tables
(for instance, after updates to the data or after changing the list of background variables),
the whole operation had to be repeated once more... manually.
So, it became clear that some functionality had to be added to S2X that would allow saving table definitions
and automatic recalculations of all tables. That's how the scripting language in S2X originated;
and all other extensions to the program that support script editing, verification and execution.
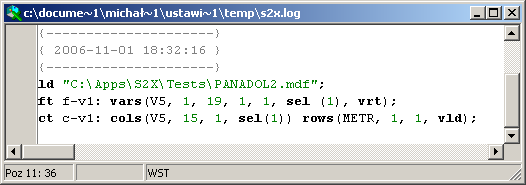
In the above example, the first three lines contain scripting comments,
in the next line we have the instruction that loads a data file,
in the next two - definitions of frequency and cross-tabs tables.
The following instructions are available in SPSS-2-Excel's scripting language:
- ld (load data) - opens a data file (and closes the previously opened one),
- is (include script) - runs one script from inside another,
- sed (set export directory) - sets the folder to which all tables will be exported,
- mtv/mth (merge tables vertically/horizontally) - merges one table file to another table file,
- wd (weight data) - turns data weighting on or off,
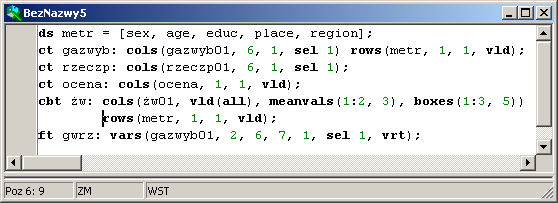
- ds (define set) - defines sets of variables,
- df (define filter) - defines filters,
- sc (select cases) - selects cases for analysis (all or a sub-group);
the instruction's parameter is one of the following: an expression that defines cases to be selected or a name of a previously defined filter,
- co/fo/mo/bo/cbo - calculation options of the respective table types
(the consecutive parameters of these instructions correspond to options available in their dialog windows);
the defined options will be used in the calculations of all tables defined from this point on (unless we change them);
when modifying calculation options, it's enough to define the changes in the options -
there's no need to define all options every single time,
- ct/ft/mt/bt/cbt - table definitions of the respective types
(the consecutive parameters of these instructions correspond to options available in the table definition dialog windows);
the table will be computed immediately according to previously defined (or default) calculation options
and exported to a file with the given name to the defined (or current) folder.
To minimize the learning curve, all operations executed manually are saved to the program's log file
(in the format of the scripting language). So, when you have to create your own script,
it's usually best to open the log file and copy the instructions found there and then edit those instructions
to suit your needs.
Moreover, when editing a script, you can run a table definition dialog window,
and instead of creating the table, save its definition to the script file.
The script editor present in S2X is a fully functional text editor integrated with script management:
- syntax highlighting,
- undo/redo,
- full set of block operations,
- search and replace functions,
- bookmarks,
- verification of the whole script or only its highlighted part,
- list of found errors and navigation between those errors,
- running the whole script or only its highlighted part.
Top
The first version of the application was written in 1993.
It worked under DOS and was developed using Borland Pascal and the Turbo Vision library.
Around 2000, it was converted to Delphi and Windows. Below is the image of the original,
DOS version, of the application:
Top
Top
|
|
|
|