|
|
 |
| Radio |
 |
Details:
As other data in the program, radio audience data is analyzed in pivot tables,
in which the various parameters may be moved between dimensions (columns, rows, and layers).
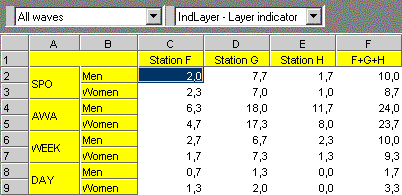
In the table below, audience indicators and target groups were placed in rows,
stations and groups of stations - in columns:

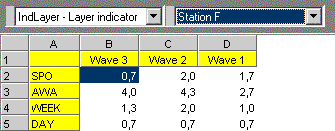
To switch from group comparisons to, for instance, trend analysis,
it is enough to move target groups to layers, and waves to columns or rows:

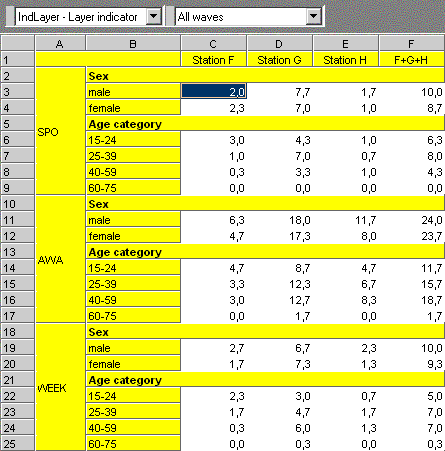
You can also cross audience data by other questions:

Top
The following audience indicators are available:
- Awareness (spontaneous, prompted)
- Weekly reach
- Daily reach
- Reach in quarters
- Market share
- Mean audience time (in minutes)
- Average Quarter Audience
"Percentage" indicators may by estimated to the given population.
Other indicators specific to a given survey may be added, such as program evaluation.
Top
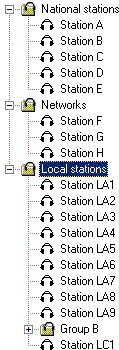
In the application, radio stations are displayed according to a predefined structure:

You can also select stations based on the regions they are available in (only those stations will be displayed).
Stations may be merged to calculate results for groups of stations.
Top
As all analyses in the application, radio analyses are defined by one of the available wizards:
- Audience - audience of selected stations, sorted alphabetically
- Ranking - a fast analysis that displays the results for selected indicators and selected stations and groups of stations
- Compare waves - analysis of audience trends
- Compare two target groups - compares audience in two target groups (a simpler version of the wizard below),
- Compare target groups - compares indicator values in two or more target groups
- Colistening - shows the percentage of respondents that listen to one station among respondents that listen to another station
- Structure - allows you to cross audience indicators by other questions (e.g. demographics)
- Audience x questions - displays audience results in groups defined by selected questions
- Listening by days of the week - crosses indicators for a given station or group of stations by days of the week (that can be merged into day types such as weekdays / weekends)
- Listening by quarters - crosses indicators for a given station or group of stations by listening time (these can be merged into day parts)
- Listening by places - shows where respondents listen to radio stations (e.g. work, home, car, etc.)
- Signal sources - shows the source of the signal of stations respondents listen to (e.g. aerial, cable, internet, etc.)
Other wizards may be added, if necessary.
Top
|
|
|
|


 Products
 YAC Data Kit
 YAC Data Analyzer
 Radio
Radio