|
|
 |
| YAC Data On-Line |
 |
YAC Data On-Line (YDOL),
a version of our data analysis program that runs under internet browsers, is already available.
Details:
An internet enabled version of YAC Data Analyzer is intended to aid you in data analysis in the following situations:
- when you need quick access to the most recent data (e.g. from promotions),
- distribution of restricted in content or demonstration versions of syndicate studies,
- when you need access to the data outside your office (and you need to quickly look at some of the results),
- when a survey should be distributed to many users that do not have YAC Data Analyzer installed (e.g. sales force),
- when you need to analyze data on other operating systems than Windows.
Moreover, surveys that are currently available under the YAC Data Analyzer application,
can be easily moved to YDOL (it is the same survey file).
Top
By using the YDOL application, the user may view reports prepared earlier by a research institute.
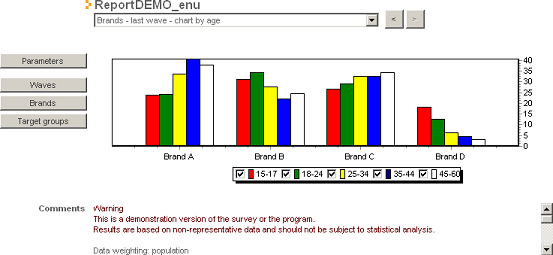
These reports may consist of many various tables (that may include significance markers):
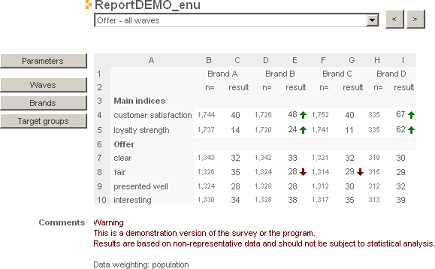
And charts:
Top
Predefined reports can be supplemented with a function
for recalculating all results for predefined variables, target groups and/or survey waves.
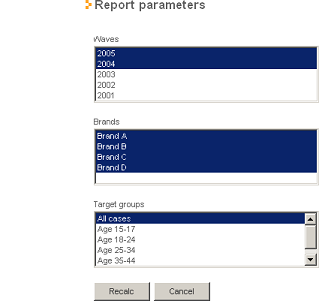
The report will be recalculated for the highlighted elements above.
These can be filters (include all respondents from the first two waves)
as well as variables in the table rows and/or columns (include all brands).
Top
Predefined reports allow for fast distribution of research results and are very easy to use even for novice users.
However, they may not display all data relevant to the user. In this situation, instead of waiting for a new version
of a report, the user may prepare new analyses himself.
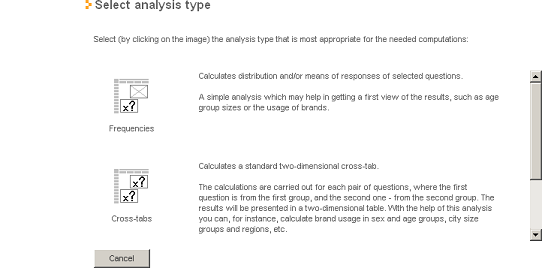
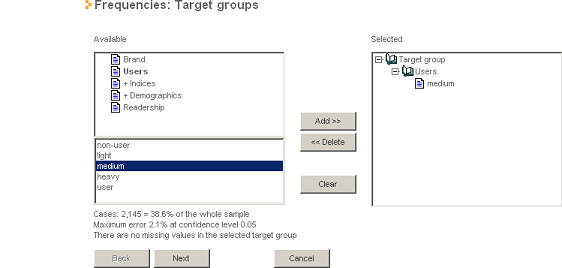
To define an analysis, the user selects one of the wizards to define tables of frequencies, cross-tabs or cross-tabs with means.
Next, the application prompts the user for target groups:
questions:
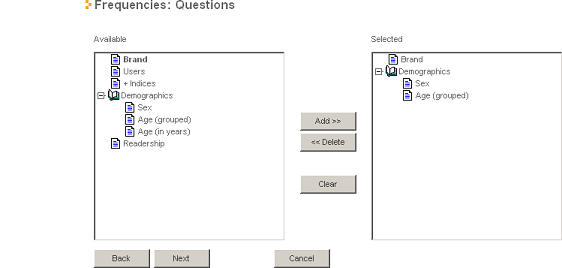
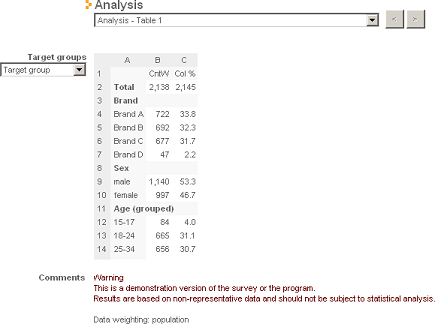
as well as other parameters (e.g. statistics) that should be displayed in the table.
After all parameters are specified, the results are calculated on the server and displayed to the user.
Later, the user may define new analyses, modify the current analysis (by editing one of the parameters: target groups,
questions, or statistics), or display results in a format that allows for printing and copying to other applications.
Top
A demo versions of the YAC Data On-Line application is available
here - please take a look!
The demonstration survey ReportDEMO and the ReportDEMO report show how dynamic analyses work.
Both demonstration surveys allow defining new reports.
General Social Survey data is also available on our
server.
Although this is an on-line analysis program, a second identical version is available
for off-line analyses.
Top
|
|
|
|