|
|
 |
| Snack Panel |
 |
A specialized module for the YAC Data Analyzer application
prepared in 2002 for TNS OBOP for the analysis of data from the snack panel survey.
The following extensions were prepared for this survey:
Details:
Survey data consisted of two parts: information about respondents and data about the usage of various brands.
Moreover, usage was measured over several days.
Before the panel survey, data in the program could consist of a single table only: respondents by questions.
If we wanted to analyze panel data in such a format, although possible, this would lead to data overgrow
(for each brand, we would need as many variables as the maximum number of possible usage occasions,
meaning the number of days in the panel) and would overly complicate the computation and processing algorithms;
moreover, both extensions would be strongly tied to this data and would be hard to reuse in other similar surveys.
That's why, when thinking about adapting our software for this survey,
we decided on a general extension where the data set can be divided into subsets:
the main data set containing information about respondents and additional data sets (of which there can be more than one)
that map zero or more records to each respondent (so having a classic 1-to-many association).
Obviously, we needed to extend the analytical capabilities of our application:
- in dialog windows, questions from all data sets are visible and selectable,
- the user can select the base for calculations (respondents, records in the secondary data sets).
The second case is needed, for instance, when we want to:
- analyze the users of brand X (such as: how many users use brand X),
- analyze the usage of brand X (such as: what is the share of brand X in the total used volume of a product category
- the data gathered in the panel not only measured the usage of a brand, but also the volume).
Top
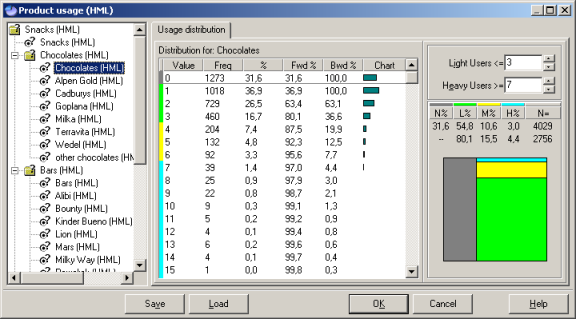
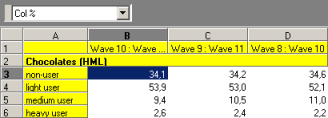
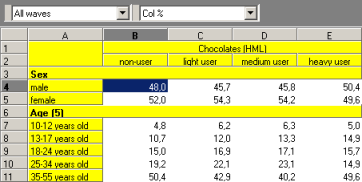
Another extension was to allow the division of respondents into groups of heavy, medium and light users (and non-users),
and for groups defined thus, provide the necessary analyses. Moreover, these groups should be definable:
- at the level of the whole survey (global settings),
- at the level of individual analyses (local settings)
and
- at the level of all snacks,
- at the level of product categories - such as chocolates or bars (picture 1 below),
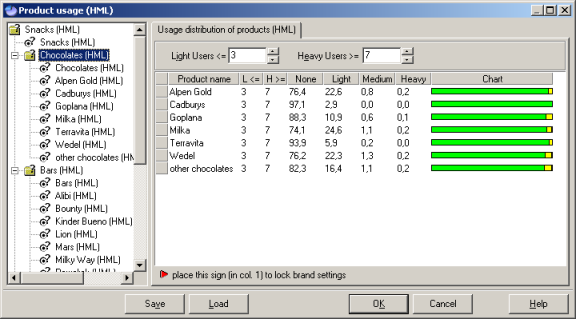
- default values for brands in a given product category (picture 2 below),
- at the level of individual brands.
Top
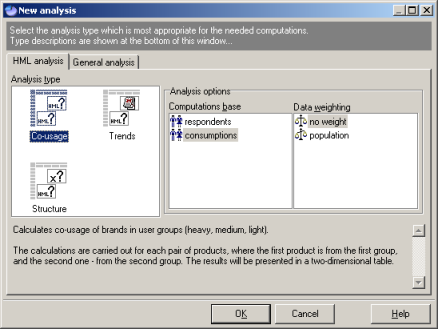
For the analysis of the new data, three new wizards were also prepared:
- Co-usage

- Trends
- Structure
Moreover, all new variables could be used as any other question and response (for instance, in target group definitions).
Top
|
|
|
|