|
|
 |
| Effective Reach and Optimization |
 |
Introduction
This article discusses some nuances of press media plan optimization
where the possible solutions are limited by criteria defined for Effective Reach
or for the CPP (Cost per Point) and CPT (Cost per Thousand) indicators
in their versions based on Effective Reach.
First, let's make clear the terminology, as being used in
YAC Data Analyzer's
press
media plan
optimizer:
-
press media plan
a list of the numbers of insertions in press titles (newspapers, magazines);
for each title, 0 or more insertions may be defined
-
press media plan optimization
a process that searches for the best possible media plan
and takes into account criteria defined for readership indicators;
these criteria may be defined for a single title or for a group of titles
(including the whole media plan - the group of all titles in the analysis);
for instance, we may want to limit all solutions to those that define at most 10 insertions
and a budget of at most 10,000 credits;
finally, at least one indicator must be defined as the indicator that will be optimized -
minimized, such as budget, or maximized, such as reach
-
Effective Reach
this is the percent of viewers that the media plan will reach at least n times;
thus ER 1+ shows the Reach of the media plan (viewers that will see your ad at least once),
and ER 3+ shows those viewers that will see your ad at least three times;
in YAC Data Analyzer, you can define exact ranges on the numbers of contacts:
- ER 1 - viewers reached exactly 1 time
- ER 1:3 - viewers reached 1 to 3 times
- ER :3 - viewers reached at most 3 times
-
CPP (Cost per Point)
this is the cost of the media plan divided by the number of points that the media plan generates;
in YAC Data Analyzer this indicator comes in three flavors:
- CPP-G - points are taken from the GRP (Gross Rating Points) indicator
- CPP-R - points are taken from the Reach indicator
- CPP-ER - points are taken from the Effective Reach indicator
for CPP-ER you also must define the number of contacts;
so, with this indicator, you will actually have CPP-ER 3: or CPP-ER 1:3
-
CPT (Cost per Thousand)
this is the same indicator as CPP,
except that (percentage) points are recalculated into thousands of viewers;
it also comes in the respective three versions (CPT-G, CPT-R, CPT-ER)
Ok, with this out of the way, let's return to the main topic.
When defining optimization parameters using ER, or CPP/CPT based on ER,
be careful what numbers of contacts and what criteria you define for these indicators.
It is quite easy to introduce definitions that will make the optimizer unable to find
even a single media plan that meets all criteria!
Below, we will be talking about Effective Reach only, but everything applies to CPP-ER and CPT-ER, too.
There are two types of criteria that you can define for a readership indicator in YDA's optimizer:
- range of possible values,
- minimization / maximization.
Let's take a look at each of these types:
Range of possible values
In this case, you want your media plan to meet specific criteria for a given indicator.
Thus, you might define that for the whole media plan, you want ER 1: to be greater than 20%
(for instance, when minimizing the budget).
However, even in this simple case, it is possible to define an impossible (unreachable) value -
since even with many insertions in many titles, the media plan's total reach might be less than 20%.
In YDA, you will see that the program cannot find any media plans that meet all criteria.
You'll have to either remove some of these criteria or relax them a bit
(for instance, lowering 20% mentioned above to 15%).
The problem complicates further if we define criteria on ER 1 (or similar indicators, such as ER 2:4).
The values of these indicators (which define exact numbers of contacts) may be quite low.
And usually with a higher number of insertions, these values may actually decrease.
Thus, even when a media plan has a reach of 50%, ER 1 may not be greater than several percent.
Adding a criterion that ER 1 must be greater than, let's say, 5%, may again lead to the optimizer
being unable to find a media plan meeting this criterion...
The case of ER with an exact number of contacts defined is further discussed in the point below.
Minimization / maximization
Another issue appears when you try to optimize the ER indicator.
First, be careful when optimizing indicators such as ER 10: (at least 10 contacts) for
a single title or for a small group of titles. It is quite possible
that a media plan will be limited to only several insertions in a single title (or a small group),
thus having ER 10: equal always to zero. Hence, optimization will find various solutions,
but the results will be pretty much random (all solutions will have the maximum value of ER 10: at zero).
Second, be careful when optimizing indicators such as ER 1 (not ER 1:, but exactly a given number of contacts
or a small range of contacts, such as ER 1:3). The behavior of this indicator is not intuitive -
its values may decrease for some numbers of insertions and then start to increase with higher numbers of insertions.
And, for instance, ER 1 usually has its highest value for only a single insertion.
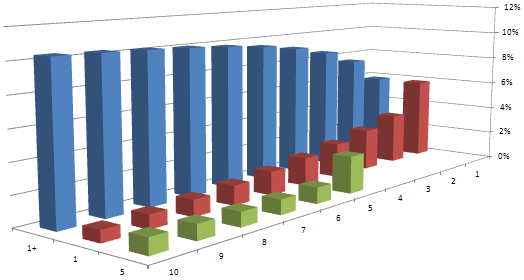
Take a look at the chart above. Three indicators are shown - values for insertions 1 to 10:
- in blue, ER 1: is shown,
- in red, ER 1,
- in green, ER 5.
Now, note that ER 1: is monotonic - it increases with the increase in the number of insertions.
Thus, maximization of ER 1: will work as expected - the higher the number of insertions, the higher the value of ER 1:.
However, note that ER 1 has its highest value at a single insertion. Thus, the optimizer,
when maximizing ER 1, will oscillate around this single insertion. But when minimizing ER 1,
the optimizer will either select zero insertions (when ER 1 = 0%), or, provided other criteria don't prevent this,
will increase the number of insertions indefinitely (since ER 1's value decrease there).
Finally, ER 5 has its highest value at 5 insertions, decreases up to 8 insertions, but then starts to increase again.
Now, when maximizing ER 5, the optimizer will probably remain at 5 insertions since there are no higher values of ER 5
or those higher values are for much higher numbers of insertions
(and the optimizer will not change the number of insertions by such big values).
When minimizing ER 5 (but with an additional criteria added that it cannot be equal to zero),
the optimizer will oscillate around 8 insertions. Without these additional criteria we will get random numbers of insertions
between 0 and 4...
Summary
YAC Data Analyzer's optimizer is a powerful tool
that allows for criteria and optimization on many different readership indicators.
However, you must pay close attention to the indicators chosen for optimization,
and especially be careful about using indicators based on Effective Reach and limited numbers of contacts,
since values of these indicators may behave quite unexpectedly.
Top
|
| Comments |
Alas!
No comments yet...
|
|
Top |
|
Top
|
|
|