|
|
 |
| Press |
 |
Details:
As other data in the program, press readership data is analyzed in pivot tables,
in which the various parameters may be moved between dimensions (columns, rows, and layers).
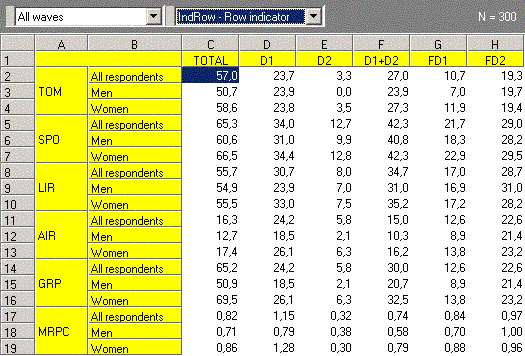
In the table below, readership indicators and target groups were placed in rows,
titles and groups of titles - in columns:

To switch from group comparisons to, for instance, trend analysis,
it is enough to move target groups to layers, and waves to columns or rows.
Top
The following readership indicators are available:
- Awareness (top of mind, spontaneous, prompted)
- Last Issue Readership, Average Issue Readership (Average Rating), Season Cycle Readership
- Ever Read, Reads Regularly
- Number of Issues Read, Number of Contacts with an Issue, Readers per Copy
- Gross Rating Points, Gross Impressions
- Opportunities to See (in the OTS n and OTS n+ versions)
- Cost per Point, Cost per Thousand (both in the GRP, OTS and OTS+ versions)
- OTS levels may be merged (e.g. OTS 1:3), also for the CPP and CPM indicators
- Average Frequency
"Percentage" indicators may by estimated to the given population.
Other indicators specific to a given survey may be added, such as
content evaluation or availability in distribution points.
All available indicators are divided into several groups for easier access (e.g. general, media plan, auxiliary).
Top
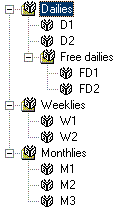
In the application, titles are displayed according to a predefined structure:

You can also select titles based on the regions they are available in (only those titles will be displayed).
Titles may be merged to calculate results for groups of titles (e.g. media plan indicators).
Top
As all analyses in the application, press analyses are defined by one of the available wizards:
- Readership - readershiop of selected titles, sorted alphabetically
- Ranking - a fast analysis that displays the results for selected indicators and selected titles and groups of titles
- Compare waves - analysis of readership trends
- Compare two target groups - compares readership in two target groups (a simpler version of the wizard below),
- Compare target groups - compares indicator values in two or more target groups
- Coreadership - shows the percentage of respondents that read one title among respondents that read another title
- Structure - allows you to cross readership indicators (also media plan) by other questions (e.g. demographics)
- Readership x questions - displays readership results in groups defined by selected questions
- Price analysis - compares price indicators for various titles and different price lists
- Media plan - define insertions and analyze media plan indicators for many media plans
- Media plan optimizer - automatically searches for the best insertion distribution that meets given constraints
Other wizards may be added, if necessary.
Top
|
|
|
|


 Products
 YAC Data Kit
 YAC Data Analyzer
 Press
Press